

Description
KloudStack Observability for Azure connects a WordPress site to Azure Application Insights, so
you can see request performance, errors and browser telemetry in Azure Monitor alongside the
rest of your Azure estate.
The plugin is built specifically for WordPress hosted on Azure. It reads its configuration from
App Service application settings automatically, names telemetry using the Azure site, slot and
region so one Application Insights resource can serve many sites, and produces a telemetry
schema designed to work with Azure Monitor workbooks.
Features
- Server-side request telemetry with normalised route names
- Uncaught exception and fatal error telemetry
- Browser telemetry via the official Application Insights JavaScript SDK
- Correlation between browser and server telemetry using W3C trace context
- Automatic Azure environment detection — App Service, Container Apps, AKS and Virtual Machines
- Cloud role naming from the Azure site and deployment slot
- Configurable sampling to control Azure ingestion cost
- Privacy controls: IP anonymisation, query-string redaction, consent gating
- Built-in diagnostics self-test and WordPress Site Health integration
Designed for Azure
This plugin assumes Azure hosting. It will run elsewhere if you supply a connection string, but
Azure environment enrichment will be unavailable and support is limited to Azure deployments.
Performance
Telemetry is buffered during the request and transmitted only after the response has been
released to the visitor, so Application Insights latency or availability never affects your
site’s response time. A circuit breaker suspends transmission if the ingestion endpoint becomes
unreachable.
Trademarks
Azure, Microsoft Azure and Application Insights are trademarks of the Microsoft group of
companies. This is an independent plugin and is not affiliated with, endorsed by, or sponsored
by Microsoft.
External services
This plugin sends data to Microsoft Azure Application Insights, a third-party service operated
by Microsoft. It does this so that telemetry collected from your site can be stored, queried and
visualised in Azure Monitor.
What is sent, and when: on each non-excluded page request, the plugin transmits the request
route, duration, HTTP response code, and contextual data about the WordPress installation
(WordPress version, PHP version, active theme, plugin count, memory usage, query count) to the
Application Insights ingestion endpoint configured for your Azure resource. Uncaught exceptions
and fatal errors are transmitted with their message, type and stack trace. If browser telemetry
is enabled, the Application Insights JavaScript SDK is loaded in visitors’ browsers and sends
page views, AJAX calls and JavaScript errors directly to the same endpoint.
Nothing is sent until you turn it on. All telemetry is off by default. On a fresh install the
plugin transmits nothing at all — not server-side request data, and not browser data — until you
enable it on the settings screen. Browser telemetry is a second, separate opt-in: no JavaScript
SDK is loaded and no visitor data is collected in the browser unless you enable that as well.
Server-side telemetry additionally requires an Application Insights connection string; without
one, nothing leaves your site regardless of the settings.
Visitor data: client IP addresses are anonymised before transmission by default. Query
strings are redacted against an allowlist by default. Request and response headers, which may
contain cookies and authorization data, are not transmitted unless you explicitly enable
that option.
Cookies are off by default. When you enable browser telemetry it runs in cookie-less mode,
so the SDK sets no ai_user or ai_session cookies and, in most jurisdictions, no visitor
consent obligation arises from using it.
The trade-off: without those cookies Application Insights cannot group requests into sessions or
distinguish returning visitors, so reports show page and dependency timings but not “users”
or “sessions”. If you need that aggregation, turn cookie-less mode off in Settings — but the
cookies then require visitor consent in most jurisdictions, and obtaining it becomes your
responsibility. A kloudstack_obs_has_consent filter is provided so a consent management
platform can gate injection.
Endpoints contacted: the Application Insights ingestion endpoint from your connection string
(typically https://<region>.in.applicationinsights.azure.com or
https://dc.services.visualstudio.com), and https://js.monitor.azure.com for the JavaScript
SDK unless the bundled local copy is selected in settings.
Microsoft terms of use: https://azure.microsoft.com/support/legal/
Microsoft privacy statement: https://privacy.microsoft.com/privacystatement
No data is sent to KloudStack. The plugin does not phone home.
Screenshots
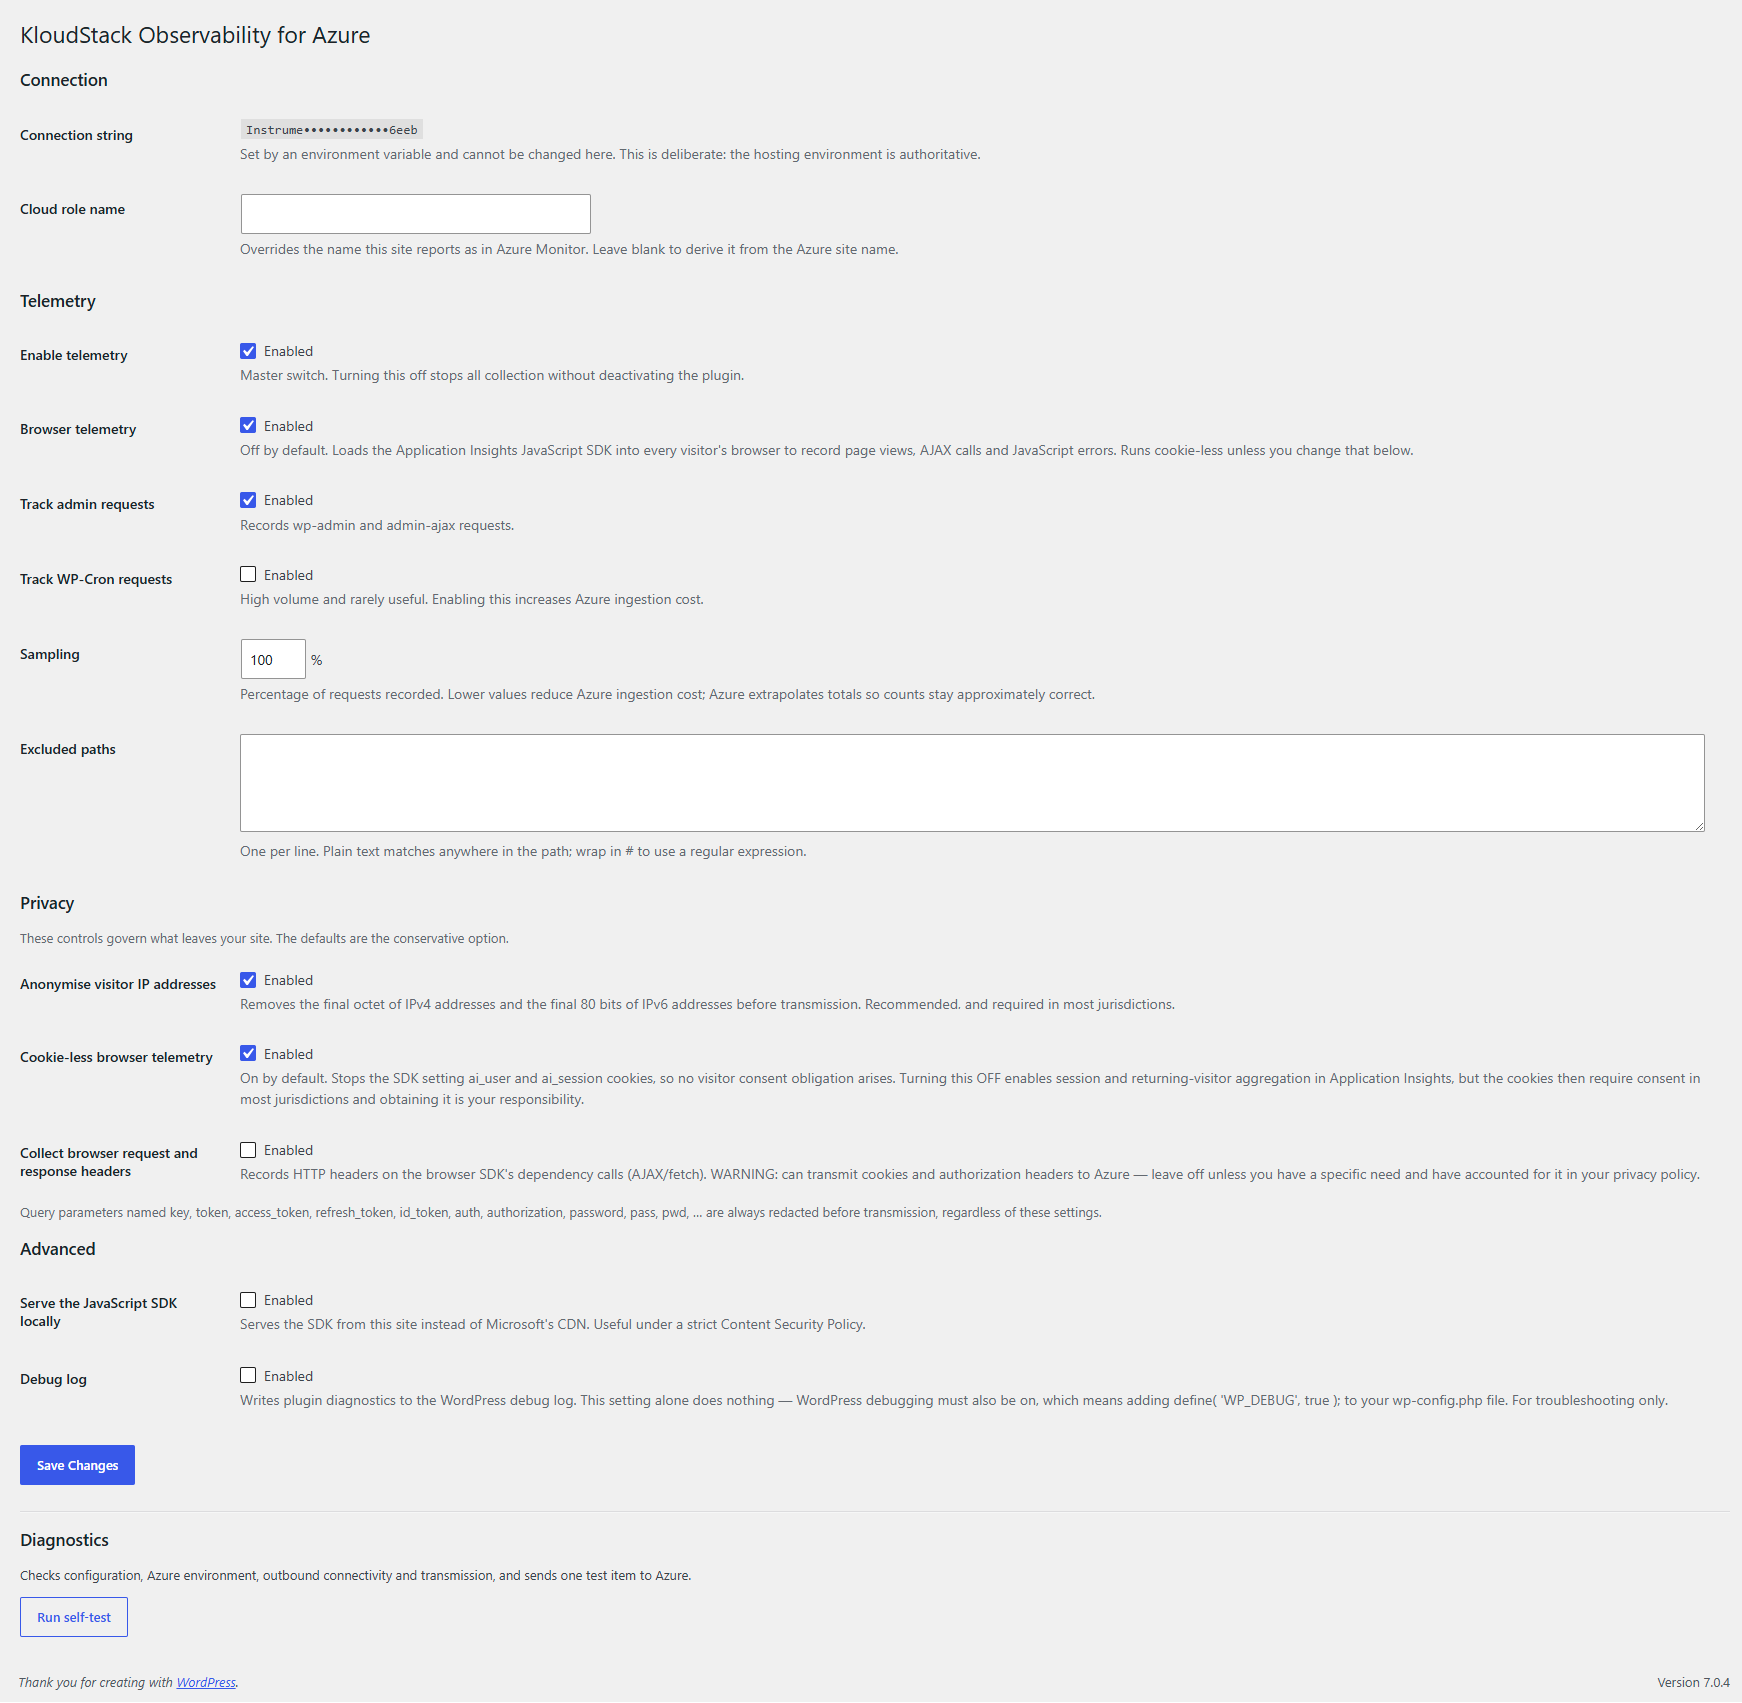
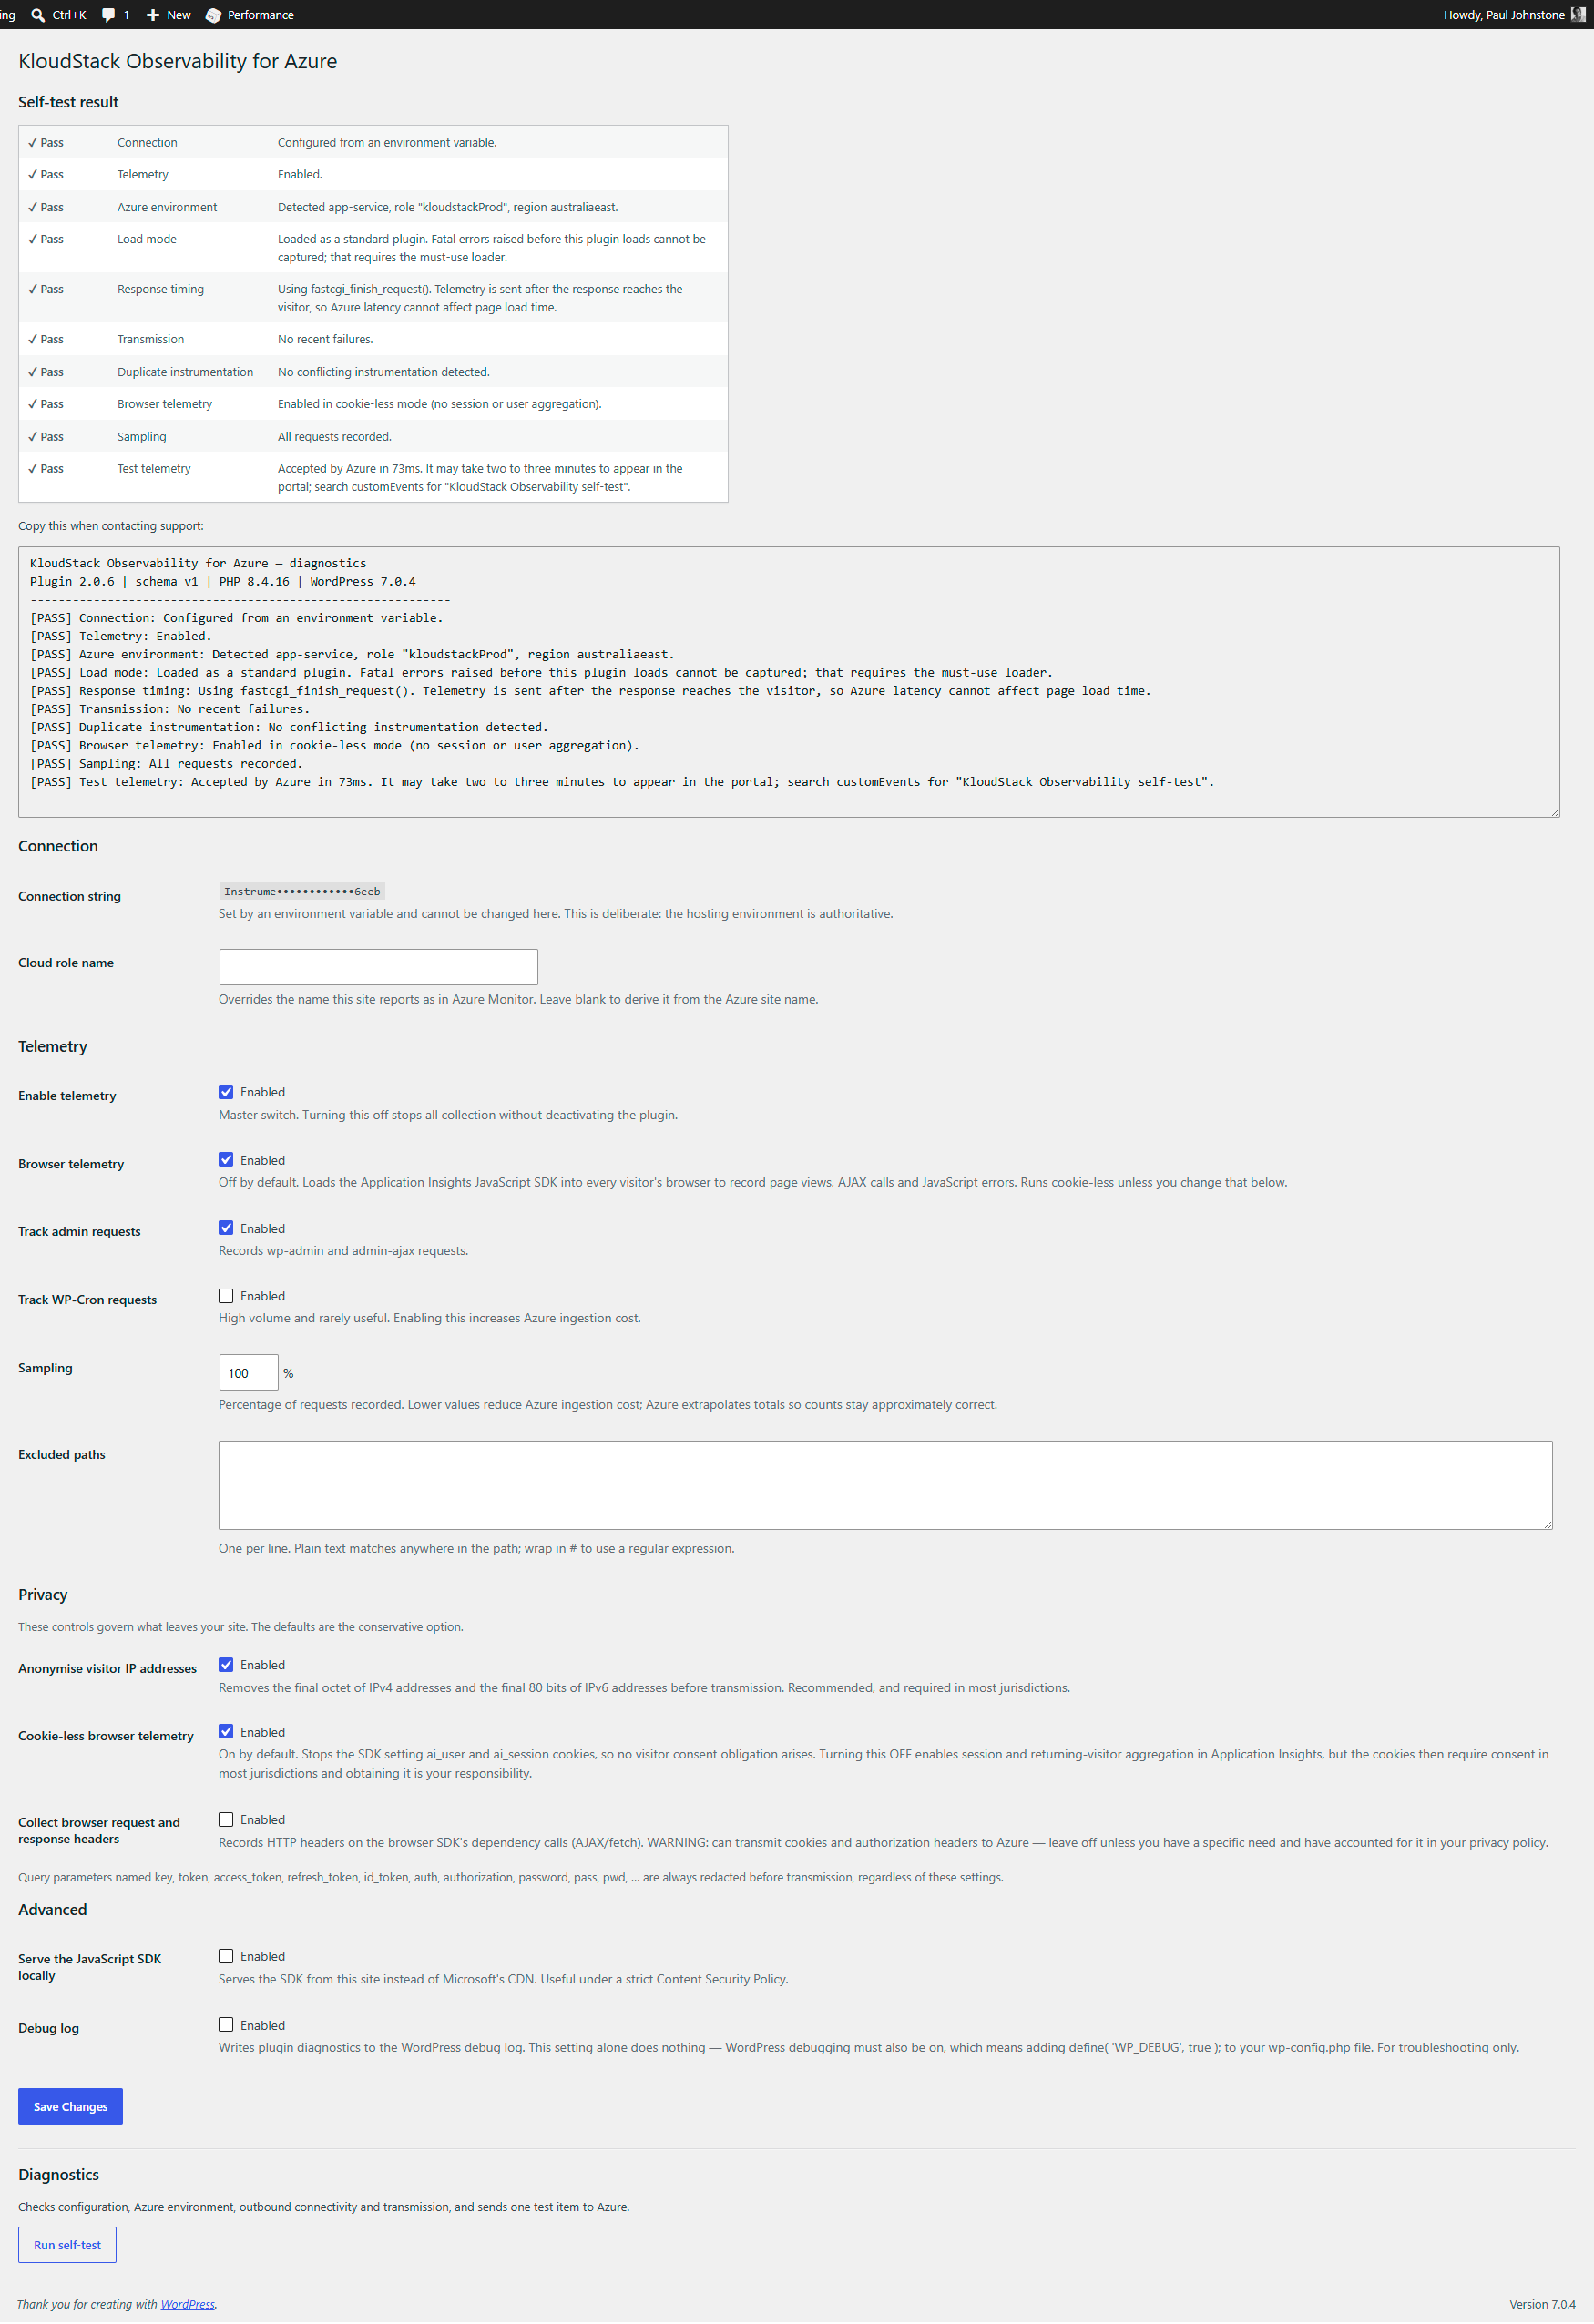
Installation
- Install and activate the plugin.
- If your site runs on Azure App Service, add
APPLICATIONINSIGHTS_CONNECTION_STRINGto your application settings. The plugin will detect it automatically. - Otherwise, go to Tools > KloudStack Observability and paste your Application Insights connection string.
- Run the built-in self-test to confirm telemetry is reaching Azure.
FAQ
-
Do I need an Azure subscription?
-
Yes. The plugin sends telemetry to an Application Insights resource in your own Azure
subscription. Azure charges for telemetry ingestion and retention apply under your Azure
agreement. -
Does this slow down my site?
-
No. Telemetry is transmitted after the response has been released to the visitor, so Azure
latency does not affect page load time. -
Why do my browser page views outnumber my server requests?
-
If you use full-page caching, cached responses are served without running PHP, so no server-side
request telemetry is produced — while the browser SDK still fires. This is expected. -
Can I use one Application Insights resource for several sites?
-
Yes. Each site reports a distinct cloud role name, derived from the Azure site name or set
manually in settings.
Reviews
There are no reviews for this plugin.
Contributors & Developers
“KloudStack Observability for Azure” is open source software. The following people have contributed to this plugin.
Contributors
Translate “KloudStack Observability for Azure” into your language.
Interested in development?
Browse the code, check out the SVN repository, or subscribe to the development log by RSS.
Changelog
2.0.6
- The Debug log setting now says plainly that it does nothing on its own, and names the
define( ‘WP_DEBUG’, true ); line that has to be added to wp-config.php for it to take effect.
2.0.5
- The plugin no longer writes a log file of its own. Debug output is handed to WordPress via
error_log(), so WP_DEBUG_LOG decides where it lands. The setting itself is unchanged.
2.0.4
- The debug log filename now carries a per-site random suffix. The .htaccess written beside it
denies direct access on Apache, but nginx ignores .htaccess entirely, so on those servers a
fixed, identical-everywhere filename was guessable and the log fetchable. Both guards are kept.
2.0.3
- Hosting platform management API calls are excluded from request telemetry, alongside the health
probe. These are the host calling the site rather than the site’s own traffic, and being slow by
nature they dominated the slowest-routes report.
2.0.2
- Health probe exclusion now also matches sites using plain permalinks, where the same route is
reached as /?rest_route=/custom/v1/healthcheck rather than /wp-json/custom/v1/healthcheck.
2.0.1
- Telemetry is now OFF by default and must be enabled by the site owner. Nothing is transmitted
until you turn it on, in line with WordPress.org guidelines 7 and 9. - The settings screen now states plainly when telemetry is off and nothing is being sent.
- The debug log is written to a protected
kloudstack-azure-observabilityfolder inside the
uploads directory, resolved with wp_upload_dir(), instead of the uploads root. - The browser SDK snippet is registered through wp_add_inline_script() rather than emitted as a
raw script tag. - Hosting platform health probes are excluded from request telemetry. On a low-traffic site these
could account for over 99% of recorded requests, hiding the site’s real traffic and adding
needless ingestion cost.
2.0.0
- Initial public release.